Cash Flow Management: Maturity, Collections, and Risk Limits
What Is Cash Flow Visibility?

Without a clear view of cash, sound financial decisions are hard to make
Cash flow visibility means a business can forecast, monitor, and manage its future cash inflows and outflows. That is a good deal more than glancing at the bank balance: it means accounting for receivables with payment terms, scheduled disbursements, seasonal swings, and the contingencies you did not see coming. In practice, that last part is where most of the difficulty lives.
The Three Dimensions of Cash Flow Visibility
- Historical Analysis: Understanding past cash flow patterns (seasonal fluctuations, customer payment habits).
- Current Status: Real-time cash position, overdue receivables and payables, and open orders.
- Future Projection: Short-term (weekly), medium-term (monthly), and long-term (quarterly) cash forecasts.
Why Is It Critical?
When cash flow visibility is weak, the same problems tend to show up:
- Liquidity crisis: Unexpected cash shortages that force urgent, costly financing.
- Missed opportunities: Strategic investments postponed simply because the cash was not there.
- Supplier relationships: Partnerships strained by late payments.
- Cost of credit: High interest expenses from unplanned borrowing.
Key Concept
Do not confuse cash flow with the profit and loss statement. A company that looks profitable on paper can still hit a cash crunch if its receivables sit uncollected, while a company posting a loss can generate a cash surplus after selling assets. That is exactly why you have to read both together.
DSO and DPO Optimization

DSO and DPO are the first two numbers to watch on the cash cycle
When you manage cash flow, the two metrics that earn their keep are DSO (Days Sales Outstanding) and DPO (Days Payable Outstanding). Get both right and you free up a meaningful amount of working capital.
DSO (Days Sales Outstanding) – Receivables Collection Period
DSO tells you the average number of days it takes to collect customer receivables.
Calculation Formula
DSO = (Trade Receivables / Net Sales) x 365
Representative example: for a 500,000 receivable balance and 3,000,000 in annual sales:
DSO = (500,000 / 3,000,000) x 365 = 61 days
DSO Improvement Strategies
- Early payment discounts: Offer a discount for paying before the due date (say, 2% for payment within 10 days).
- Accelerate invoicing: Close the gap between goods delivery and invoice issuance.
- Automated reminders: Send emails or SMS automatically as the due date approaches.
- Payment convenience: Give customers more than one way to pay, whether card, wire transfer, or open account.
- Credit control: Check outstanding receivables before you approve a new order.
DPO (Days Payable Outstanding) – Payables Payment Period
DPO is the flip side: the average number of days it takes you to pay suppliers.
Calculation Formula
DPO = (Trade Payables / Cost of Purchases) x 365
DPO Optimization
- Negotiate terms: Ask for reasonable extensions without straining the supplier relationship.
- Payment schedule: Spread payments across specific days of the week instead of bunching them onto one.
- Early payment opportunity: When you are sitting on surplus cash, take the early payment discount.
- Supplier segmentation: Pay critical suppliers on time and let the rest run to the end of their terms.
Cash Conversion Cycle
The cash conversion cycle measures how efficiently your working capital works:
CCC = DSO + DIO – DPO
DIO (Days Inventory Outstanding) here is the inventory turnover period. The lower the CCC, the faster cash moves through the business rather than sitting in stock or receivables.
Aging Analysis and Early Warning
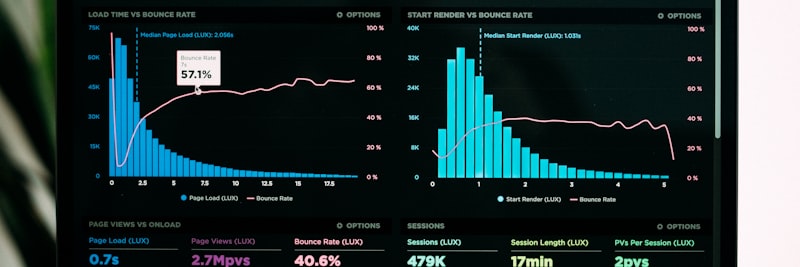
An aging report is the most practical way to catch receivables risk before it grows
Aging analysis sorts your receivables and payables by how old they are so the risk becomes visible at a glance. It is what lets you decide which collections to chase first and spot potential bad debts while there is still time to act.
Standard Aging Categories
- 0-30 days: Not yet due or recently due (low risk).
- 31-60 days: Slight delay (medium risk, needs follow-up).
- 61-90 days: Significant delay (high risk, active intervention).
- 91-180 days: Serious delay (very high risk, special follow-up).
- 180+ days: Potential bad debt (time to consider a provision).
Using the Aging Report Effectively
Weekly Routine
- Update the aging report at the start of every week.
- Share receivables past 60 days with the sales team.
- Report receivables past 90 days to senior management.
- Evaluate legal proceedings for anything past 180 days.
Customer-Based Analysis
Read the aging report customer by customer, not just as a total:
- Which customers are chronically late?
- Which way is the delay trend moving among your major accounts?
- Is there a repeating pattern by industry or region?
Early Warning Systems
If you want to manage cash flow proactively, put a few early warning mechanisms in place:
- Credit limit breach alarm: Automated notification when a customer exceeds their limit.
- Delay trend alarm: A warning when the same customer strings together consecutive delays.
- Concentration alarm: A warning as receivables from a single customer take up more of the total.
- Industry risk alarm: A warning on customer movements in troubled sectors.
Caution
In aging analysis, the amount matters as much as the number of days. A small receivable 100 days overdue can carry less risk than a large one only 45 days overdue. Read your reports through both lenses, days and amounts.
Credit Limits and Risk Management

A good credit limit keeps sales and risk on the same scale
Credit limits set the ceiling on how much you will sell a customer on credit. Set them too low and you choke off sales; set them too high and you invite collection risk. The whole game is balance: a well-tuned limit supports growth and keeps risk in check at the same time.
Criteria for Setting Credit Limits
1. Payment History
- Payment performance over the last 12 months.
- Average number of days late.
- Past issues and how they were resolved.
2. Business Volume
- Monthly and annual sales volume.
- Order frequency and size.
- Growth trend.
3. Financial Status (If Available)
- Company size and capital structure.
- Industry and market position.
- References and reputation.
Credit Limit Calculation Method
Here is the basic formula:
Credit Limit = (Average Monthly Sales x Payment Term / 30) x Risk Coefficient
Risk coefficient levels:
- 0.5: High-risk customer (new, or with a history of delays).
- 1.0: Standard customer (normal payment performance).
- 1.5: Low-risk customer (spotless payment history, long-standing relationship).
Managing Limit Breaches
When a customer goes over their credit limit, these steps should kick in:
- Automated order blocking: Order entry is blocked in the system.
- Approval process: The block can be lifted with approval from the sales manager or a finance authority.
- Customer communication: The situation is raised with the customer, and payment or collateral is requested.
- Escalation: Recurring breaches are reported to senior management.
Cash Flow Forecasting Methodology

Good forecasting is less about predicting the future than preparing for it
Cash flow forecasting is the process of estimating future cash inflows and outflows. Done well, it lets you see liquidity problems coming and take precautions before they arrive.
Forecasting Time Horizons
- Short-term (1-4 weeks): High accuracy, operational decisions.
- Medium-term (1-3 months): Medium accuracy, tactical decisions.
- Long-term (3-12 months): Low accuracy, strategic planning.
13-Week Rolling Forecast
In practice, the method that works best is the 13-week (one quarter) rolling forecast:
How It Works
- Weekly cash inflow and outflow estimates are made for the next 13 weeks.
- At the end of each week, the estimates are compared against actuals.
- You run a variance analysis (forecast vs. actual).
- A new week is added on, and the forecasts are updated.
Cash Inflow Items
- Customer collections (distributed according to aging).
- Cash sales.
- Other income (interest, rent, and so on).
- Planned credit usage.
Cash Outflow Items
- Supplier payments (based on payables terms).
- Payroll and social security payments.
- Rent and fixed expenses.
- Tax payments.
- Loan repayments.
- Capital expenditures.
Improving Forecast Accuracy
To sharpen your forecasts:
- Analyze historical data: Pull out the seasonal patterns and the trends in payment habits.
- Talk to the departments: Expected orders from sales, planned purchases from procurement.
- Build scenarios: Prepare an optimistic, a realistic, and a pessimistic version.
- Dig into the variances: Why did it miss? Feed that back into the next forecast.
Field Example: Cash Flow Transformation in a Manufacturing Firm

Situation
An industrial equipment manufacturer with 120 employees, annual turnover representatively in the 15-20 million range. The problem: DSO was high at 85 days, cash visibility was poor, and the company constantly leaned on short-term credit. The finance department spent most of the week chasing collections in spreadsheets.
Steps Taken
- Weeks 1-2: Current state analysis, aging report generated, customer-based DSO calculated.
- Weeks 3-4: Credit limits redefined, automated limit control switched on in the system.
- Weeks 5-6: Collection process redesigned, automated reminder system set up.
- Weeks 7-8: 13-week rolling forecast model built.
- Weeks 9-12: Pilot implementation and fine-tuning.
Results (Representative)
- DSO: dropped from 85 days to 58 days (32% improvement).
- Overdue receivables ratio: fell from 28% to 12%.
- Short-term credit usage: down 45%.
- Forecast accuracy: 75% (for the first 4 weeks).
- Finance department efficiency: 15+ hours saved each week.
The 7 Most Common Mistakes in Cash Flow Management
1. Looking Only at the Bank Balance
The daily bank balance says nothing about the future. It ignores the invoice due at the end of the week, the monthly payroll burden, and next month’s tax bill. The balance is today’s snapshot, not the whole film.
2. Not Measuring or Tracking DSO
You cannot judge collection performance without measuring DSO. The vague sense that “it’s about the same as last month” often masks collections that are quietly slowing down. Watch the monthly DSO trend.
3. Selling Without Credit Limit Control
Shipping goods to a customer who has blown past their limit, just to hold onto the sale, is how you end up with uncollectible debt. Without automation, this check gets skipped.
4. Reviewing the Aging Report Only at Month-End
A monthly aging review means you are reacting to delays 30 days late. Weekly tracking is the minimum, and for critical customers, daily.
5. Leaving Collection Follow-up to the Sales Team
Salespeople do not want to strain the customer relationship, so they shy away from applying collection pressure. Collections belong with finance; sales should only be kept in the loop.
6. Not Accounting for Seasonal Fluctuations
Every industry and every business has a seasonal rhythm in its cash flow. Your cash needs before the new year, during summer holidays, or in a peak season are simply not the same.
7. Over-Reliance on Spreadsheets
Manual tracking in spreadsheets invites errors and eats time. Automated reporting integrated with the system is both more reliable and faster.

A systematic approach heads off most of these mistakes
Cash Flow Management Success Metrics
The following metrics can be used to gauge how well cash flow management is working (representative values):
| Metric | Baseline | Target | Measurement Method |
|---|---|---|---|
| DSO (Days Sales Outstanding) | 75+ days | < 45 days | (Receivables / Sales) x 365 |
| Overdue receivables ratio | 25%+ | < 10% | 30+ days overdue / Total receivables |
| 90+ days overdue receivables ratio | 10%+ | < 3% | 90+ days / Total receivables |
| Cash flow forecast accuracy | 50-60% | 80%+ | Forecast vs. actual variance |
| Credit limit breach ratio | 15%+ | < 5% | Orders exceeding limit / Total orders |
| Bad debt ratio | 3%+ | < 1% | Written-off receivables / Total sales |
| Cash conversion cycle (CCC) | 90+ days | < 60 days | DSO + DIO – DPO |
Cash Flow Management Checklist
Use the following checklist as a working guide for cash flow visibility and management. Go through each category in order:
- DSO is calculated monthly and trend analysis is performed
- DPO is calculated monthly and optimized
- Aging report is updated and reviewed weekly
- Cash position report is generated daily
- Credit limits are defined for all customers
- Credit limits are updated annually or based on payment performance
- Automated limit control is active during order entry
- Limit breach approval process is defined and in practice
- Credit evaluation procedure exists for new customers
- Automated reminders are sent as the due date approaches
- Escalation steps are defined in case of delay
- Collection officer is assigned and authorized
- Legal process procedure exists for problematic receivables
- 13-week rolling forecast model is established
- Forecast is updated weekly
- Actual vs. forecast comparison is performed
- Seasonal fluctuations are included in the forecast
- Major payments (taxes, premiums) are entered into the calendar
- Aging report is generated automatically in the system
- Balances are monitored in real-time via bank integration
- Credit limit controls are integrated into the system
- Cash flow metrics can be viewed on the dashboard
- Cash flow management officer is assigned
- Weekly cash status meeting is held
- Credit limit approval authorities are defined
- Communication protocol between finance and sales exists
You can reach out via the contact page to adapt this checklist to your own business.
Frequently Asked Questions (FAQ)
Get Support for Your Project
I can help guide your digital transformation initiative. Book a free preliminary call to discuss your priorities.