Timesheet ve Kaynak Planlama: Faturalanmayan Saat Rehberi
What is Timesheet Time Tracking?

In professional services firms, profitability rests largely on timesheet discipline
Timesheet time tracking means recording, categorizing, and reporting the time your people spend on projects, tasks, and activities in a consistent way. In consulting, software, legal, accounting, or architecture firms, most of the revenue is tied directly to the hours spent, so the accuracy of these records is really the business model itself. Lose an hour on paper and, more often than not, that hour is gone for good.
The Critical Importance of Timesheets
So why does every minute matter?
- Revenue accuracy: Invoices are built on timesheet data; a missing record is missing revenue
- Cost calculation: Project cost = hours spent x hourly cost
- Profitability analysis: Which projects, clients, and services actually make money?
- Resource planning: How much capacity do you have left for the next projects?
- Performance evaluation: Measuring individual and team productivity
Timesheet Data Structure
A timesheet system worth its salt should capture the following:
Mandatory Fields
- Date: The day the work was performed
- Project/Client: Which project or client the work was for
- Task/Activity: What type of work was performed
- Duration: Hours and minutes spent
- Billable/Non-billable: Is it billable or not?
Optional but Useful Fields
- Description: A brief summary of the work performed
- Phase/Milestone: Which stage of the project
- Location: Office, field, remote
- Approval status: Manager approval
Time Tracking Methods
1. Manual Entry
People enter their time at the end of the day or week. It’s the most common method and also the most error-prone—nobody remembers exactly what they did three days ago.
2. Timer-Based Tracking
You start a timer when a task begins and stop it when it’s done. More accurate, but it takes discipline, and a timer someone forgot to stop is a headache of its own.
3. Automated Tracking
Software watches which application, file, or website someone is using and sorts the time automatically. It gives the most accurate picture, though it can make people uneasy about privacy.
4. Hybrid Approach
Automated tracking plus a manual approval and correction step. It strikes a workable balance between efficiency and accuracy, which is why most modern PSA tools land here.
Tip
Require timesheet entry daily, not weekly. Entries made the same day come in above 95% accuracy, while entries made five days later slip to the 60-70% range.
Billable vs. Non-Billable Hour Management

You can’t manage profitability without getting non-billable hours under control
In a professional services firm, not every working hour carries the same weight. Billable hours bring in revenue directly; non-billable hours are pure cost. A healthy business has to keep watch over that balance.
Billable Hours
Work that can be invoiced directly to the client:
- Project work: Anything that produces a concrete deliverable
- Client meetings: Discussions related to the project
- Analysis and design: Requirements gathering, solution design
- Implementation and development: Software, reports, document production
- Testing and quality control: Verification of outputs
- Training: Training delivered to the client
- Support: Support hours within the scope of the contract
Non-Billable Hours
Work you don’t pass on to the client but that keeps the business running:
Category 1: Mandatory Administrative Tasks
- Internal meetings (weekly, monthly)
- Performance review meetings
- Mandatory training (occupational safety, compliance)
- Administrative tasks (expense reports, timesheet entry)
Category 2: Business Development
- Sales meetings and proposal writing
- Marketing activities
- Networking events
- Prospect presentations
Category 3: Competency Development
- Professional training and certifications
- Internal knowledge-sharing sessions
- Research and development
- Methodology improvement
Category 4: Non-Project Client Relations
- Account management activities
- Pro bono consulting (goodwill)
- Complaint and issue resolution
Target Billable Rates
Healthy billable rates depend on role and seniority:
| Role/Level | Target Billable Rate | Description |
|---|---|---|
| Junior Consultant/Developer | 75-85% | Very little administrative and sales responsibility |
| Mid-Level | 70-80% | Limited business development, mentoring |
| Senior/Lead | 65-75% | Proposal writing, team management |
| Manager/Director | 50-65% | Significant sales and management responsibility |
| Partner/Executive | 30-50% | Strategy, relationship management, sales |
Strategies to Reduce Non-Billable Hours
1. Meeting Optimization
- Standardize meeting durations (25 or 50 minutes)
- No agenda, no meeting
- The “could this have been an email?” test
- Stand-up meeting format
2. Administrative Automation
- A mobile app that makes timesheet entry painless
- Expense reports processed automatically from a photo
- Digitizing approval workflows
- Self-service HR portal
3. Training Efficiency
- Flexible scheduling through e-learning
- Micro-learning (short modules)
- Turning it into billable hours through on-the-job training
- Scheduling training in the off-season
Utilization Rate Calculation and Optimization

Utilization is the first number that tells you how efficiently your people are being used
Utilization rate tells you how much of someone’s total working time goes to billable work. It’s one of the most closely watched KPIs in a professional services firm, because it points straight at the engine of your revenue.
Basic Utilization Calculations
Billable Utilization Rate
The formula you’ll reach for most often:
Billable Utilization = (Billable Hours / Total Working Hours) x 100
Example: A consultant working 40 hours a week with 32 billable hours has a utilization of (32/40) x 100 = 80%
Available Hours
What’s left once you subtract leave, holidays, and mandatory training from total working hours:
- Annual total: 52 weeks x 40 hours = 2,080 hours
- Annual leave: ~15 days = 120 hours
- Public holidays: ~12 days = 96 hours
- Mandatory training: ~5 days = 40 hours
- Net available hours: 2,080 – 256 = 1,824 hours/year
Target vs. Actual Utilization
Keep an eye on the gap between target and actual:
- Target Utilization: The target set for the role (e.g., 75%)
- Actual Utilization: The rate you actually hit
- Variance: The difference (positive = target exceeded, negative = below target)
Advanced Utilization Metrics
1. Realization Rate
How much of someone’s hours actually got collected, once you account for cancellations, discounts, and the like after invoicing:
Realization Rate = (Invoiced Hours / Billable Hours) x 100
If it’s below 100%, either the work isn’t being invoiced or discounts are being handed out.
2. Effective Utilization
Put the two together to see the whole picture:
Effective Utilization = Billable Utilization x Realization Rate
Example: 75% utilization x 90% realization = 67.5% effective utilization
3. Revenue per Available Hour
How much revenue each available hour brings in:
Revenue per Hour = Total Revenue / Total Available Hours
Utilization Optimization Strategies
Reasons for Low Utilization and Solutions
| Reason | Symptom | Solution Approach |
|---|---|---|
| Insufficient work volume | High bench time | Strengthen sales pipeline |
| Incorrect resource matching | Idle capacity + overload at the same time | Improve resource planning |
| Too many internal projects | High non-billable | Prioritize internal projects |
| Long sales cycle | High proposal time | Proposal templates, acceleration |
| Competency mismatch | Specific individuals always idle | Training, reskilling, repositioning |
Risks of High Utilization
You can’t hold 90%+ utilization for long:
- Burnout: People get tired and output drops
- Quality issues: Rushed work drives up the error rate
- Stagnation: There’s no time left for training and learning
- Talent loss: Unhappy people leave
Caution
Don’t chase utilization on its own. High utilization usually walks in hand in hand with lower quality or an unhappy client. Watch utilization, quality, and customer satisfaction together.
Resource Planning Strategies

A good resource plan puts the right person on the right project at the right time
Resource planning is the work of spreading the people you have across projects as effectively as possible. In a professional services firm it’s the balance point that moves both utilization and client satisfaction at once.
Basic Concepts of Resource Planning
Capacity
Your total available man-hours. Take a 10-person team’s monthly capacity, for example:
- 10 people x 22 working days x 8 hours = 1,760 hours/month (gross)
- Set aside 20% for non-billable: 1,760 x 0.8 = 1,408 hours/month (net billable capacity)
Demand
The man-hours your projects need, both ongoing and planned:
- Committed: Projects with signed contracts
- Probable: Potential projects with 75%+ probability
- Possible: Opportunities with 25-75% probability
Capacity – Demand Balance
- Over-capacity: Low utilization, cost pressure
- Under-capacity: Delayed projects, client complaints
- Optimal: Balanced capacity with a 5-10% buffer
Resource Planning Process
Step 1: Capacity Inventory
- Competency profile of each resource
- Current project assignments
- Planned leave and training
- Part-time/full-time status
Step 2: Project Demand Forecasting
- Remaining workload of current projects
- Probability-weighted forecast of projects in the pipeline
- Seasonality and trend analysis
- New client acquisition targets
Step 3: Gap Analysis
- Competency-based supply-demand comparison
- Time-based (weekly/monthly) analysis
- Identifying critical competency bottlenecks
Step 4: Balancing Actions
When you have over-capacity:
- Redirect people to internal projects (R&D, methodology)
- Training and certification programs
- Sales support (demo, POC)
- Look for cross-selling opportunities
When you’re under-capacity:
- Bring in subcontractors or freelancers
- Adjust project timelines
- Ask the client to prioritize scope
- Urgent hiring (not a lasting fix, mind you)
Resource Assignment Criteria
Before you put a resource on a project, run through these:
- Competency fit: Do they have the skills the work needs?
- Availability: Are they free during the period in question?
- Location: If field work is involved, does it fit?
- Client preference: Is the client asking for someone specific?
- Development opportunity: Does it move their career forward?
- Team dynamics: Can they work with the current team?
- Cost: Does it fit the project budget?
PSA Tools and Integration
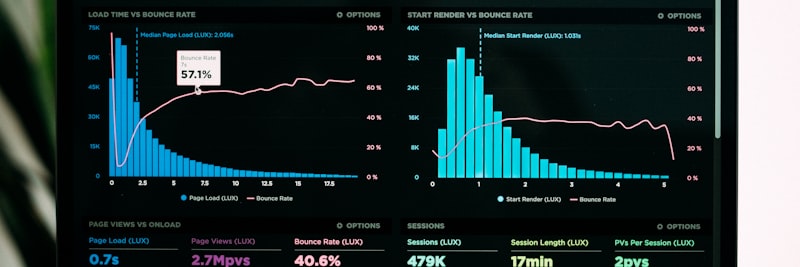
PSA tools pull scattered services operations under one roof
PSA (Professional Services Automation) tools bring a firm’s whole operation—project management, resource planning, time tracking, billing, reporting—onto a single platform. The point is to stop keying the same data into five different places.
Key Functions of PSA Tools
1. Project Management
- Project planning and scheduling
- Milestone and task tracking
- Budget and cost control
- Risk and issue management
2. Resource Management
- Capacity planning
- Competency-based search and matching
- Resource request and approval workflow
- Utilization reports
3. Time and Expense Management
- Timesheet entry (web, mobile)
- Timer and automated tracking
- Expense reporting and approval
- Project/client-based cost accumulation
4. Billing
- Time & Materials billing
- Fixed-price project tracking
- Retainer/subscription management
- Invoice generation automation
5. Reporting and Analytics
- Project profitability reports
- Resource utilization dashboards
- Client profitability analysis
- Forecast vs. actual comparison
PSA Integration Points
A PSA tool doesn’t stand on its own; it has to talk to your other systems:
CRM Integration
- Creating projects from sales opportunities
- Customer information synchronization
- Resource planning from pipeline data
ERP/Finance Integration
- Transferring invoice data to the accounting system
- Reflecting project costs in general accounting
- Budget vs. actual comparison
HR/HCM Integration
- Employee data synchronization
- Leave and absence information
- Competency profile updates
Communication Tools Integration
- Calendar synchronization
- Time entry from email
- Connection to chat/collaboration tools
PSA Implementation Considerations
- Data cleansing: Clean up customer, project, and employee data before you migrate
- Process standardization: Define the processes first, then move them into the system; do it the other way around and you’ll pay for it for years
- User adoption: No tool works without change management and training
- Avoid over-complexity: Keep it simple at the start and build on it as you go
Field Example: Timesheet Transformation in a Consulting Firm

Situation
A 45-person management consulting firm. Timesheet entry was weekly and run out of Excel. Accounting spent 3-4 days on month-end billing, so invoices went out late. Management couldn’t see project profitability in real time. With no utilization forecasting, some months brought overload and others left people sitting idle.
Steps Taken
- Process analysis: The existing timesheet and billing process was mapped end to end, surfacing 12 critical pain points
- PSA tool selection: A suitable tool was chosen after a 3-month evaluation
- Data migration: 2 years of project and client data were cleaned and loaded into the system
- Project categories: Billable/non-billable categories and activity types were defined
- Daily timesheet policy: Entry moved from weekly to daily, with a morning reminder automation in place
- Training and adoption: A 30-60-90 day training program was run for everyone
- Dashboards: Real-time utilization and profitability screens were built for management
Result (Representative)
- Timesheet completion rate rose from 65% to 95%
- Invoice preparation dropped from 3-4 days to 4 hours
- Non-billable hour rate came down from 28% to 18%
- Average utilization climbed from 62% to 71%
- Project profitability moved from monthly reporting to real-time monitoring
- Resource planning became forecastable two weeks out
7 Critical Errors in Timesheet Management
1. Weekly/Monthly Timesheet Policy
Filling in the whole week on Friday means guessing at what you did on Monday. Forgotten hours are lost revenue. A daily entry requirement pushes data accuracy up sharply.
2. Complex Category Structure
50-plus project codes, 30-plus activity types… people can’t tell which to pick, so they choose at random or dump everything into “general.” Keep the categories simple and clear.
3. Lack of Approval Process
If nobody reviews the timesheet after it’s entered, wrong or inflated entries slip through unnoticed. Manager approval and anomaly reports matter here.
4. Not Tracking Non-Billable Time
“Let’s just log the billable hours, the rest doesn’t matter.” Wrong. You can’t trim non-billable time when you don’t know where it’s going. Every hour needs to be on the record.
5. Not Using Timesheet Data
The data gets collected but only feeds billing; profitability analysis, resource planning, and performance reviews never touch it. Yet the whole reason to collect data is to make decisions with it.
6. Not Reflecting Scope Creep in Timesheets
The scope grew, but the extra work still went in as “project work.” The result: the project looks profitable on paper while it’s actually losing money. Track scope changes separately.
7. Using Employees as a Control Tool
Treating the timesheet as a micro-management stick puts people on the defensive. The pressure to “fill eight hours” produces inflated numbers instead of real ones. Build the trust first.

A healthy timesheet culture is built on trust and transparency
Time Tracking Success Metrics
Use the metrics below to tell whether your timesheet and resource planning system is actually earning its keep (representative target values):
| Metric | Baseline | Target | Measurement Method |
|---|---|---|---|
| Timesheet completion rate | 60-70% | 95%+ | Timely entered timesheets / total |
| Billable utilization rate | 55-65% | 70-80% | Billable hours / total working hours |
| Realization rate | 80-85% | 92%+ | Invoiced / billable hours |
| Non-billable hour rate | 30-40% | 20-25% | Non-billable / total hours |
| Project budget variance | +/- 25% | +/- 10% | Actual – Planned hours |
| Resource planning accuracy | 60-70% | 85%+ | Forecast vs. actual capacity |
| Invoice cycle time | 15-20 days | 5-7 days | Month-end – invoice date |
| Bench time (idle capacity) | 15-20% | 5-10% | Unassigned hours / total available hours |
Timesheet System Checklist
Keep the following checklist handy as you set up an effective timesheet and resource planning system:
A. Basic Infrastructure
- Has the timesheet entry tool been selected and installed?
- Is mobile access (phone, tablet) provided?
- Are project and client codes defined?
- Are billable/non-billable categories created?
- Are activity/task types determined?
B. Policy and Process
- Has the daily timesheet entry policy been enacted?
- Is the entry deadline and reminder mechanism established?
- Is the manager approval process defined?
- Is the escalation for late/missing entries determined?
- Is the correction and revision procedure established?
C. Resource Planning
- Are employee competency profiles created?
- Is the capacity calculation formula determined?
- Is the project demand forecasting process defined?
- Are resource assignment criteria documented?
- Is there a weekly/monthly capacity meeting calendar?
D. Integration
- Is integration with the billing system provided?
- Is the connection with the project management tool established?
- Has HR/leave system integration been performed?
- Is calendar synchronization active?
E. Reporting and Analysis
- Has the utilization dashboard been created?
- Are project profitability reports defined?
- Is the non-billable analysis report ready?
- Is there a forecast vs. actual comparison report?
- Is the anomaly/variance alert mechanism established?
F. Training and Adoption
- Has system training been provided to all employees?
- Is the user manual and FAQ document ready?
- Is the support channel (helpdesk, super user) determined?
- Are adoption metrics being monitored?
You can visit the contact page for your projects on establishing or improving your timesheet and resource planning system.
Frequently Asked Questions (FAQ)
Get Support for Your Project
I can help guide your digital transformation initiative. Book a free preliminary call to discuss your priorities.