AI Use Cases: Forecasting and Anomaly Detection
AI Scenario Selection: Where to Start?

An AI project’s fate is usually sealed by one early decision — picking the right scenario — long before a line of code is written
The nature of the business problem largely dictates which model architecture and data structure you will need, and that is exactly why AI use cases differ so much from one another. Choose the wrong scenario and you end up with projects that are technically “working” yet deliver no business value at all.
Before you commit to a scenario, ask yourself the following questions:
- What is the output? A number (regression), a category (classification), or a normal/abnormal split (anomaly)?
- What is the data structure? Tabular, text, image, or time series?
- Is there labeled data? Supervised or unsupervised?
- Real-time or batch? An instant decision or a periodic analysis?
5 Core AI Scenario Categories
In practice, operational AI applications fall into five main categories:
- Forecasting (Regression): Predicting future numerical values
- Classification: Categorizing input into predefined classes
- Anomaly Detection: Identifying non-normal data points
- Natural Language Processing (NLP): Extracting meaning from text data
- Computer Vision: Extracting information from visual data
Tip
Pick a single scenario for your first AI project. Trying to stand up several scenarios at once scatters your resources, and you end up without real depth in any of them.
Forecasting Models
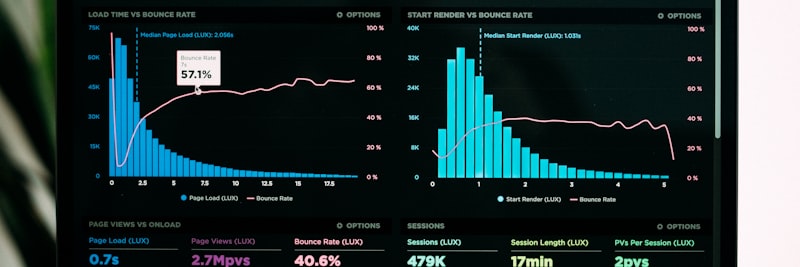
Forecasting models read the future from past data, so you can act before an event rather than after it
Forecasting models learn from historical data to predict future numerical values. It is one of the most common AI use cases you will run into in the field.
Types of Forecasting Models
Time Series Forecasting
Predicts future periods in time-dependent data:
- ARIMA/SARIMA: Statistical approach with seasonality support
- Prophet: Optimized for holiday effects and trend changes
- LSTM: Complex patterns via deep learning
- XGBoost/LightGBM: Enhanced forecasting with feature engineering
Regression (Numerical Prediction)
Predicts a dependent variable from independent variables:
- Linear Regression: Simple, interpretable, baseline model
- Random Forest Regression: Capturing non-linear relationships
- Gradient Boosting: High accuracy, complex data structures
Forecasting Use Cases
Demand Forecasting
- Product-based sales forecasting (units to be sold next month)
- Inventory replenishment optimization (when and how much to order)
- Capacity planning (production line, warehouse capacity)
Financial Forecasting
- Cash flow forecasting (collections/payments for the next quarter)
- Revenue projection (supporting budget planning)
- Cost estimation (raw materials, energy, labor)
Operational Forecasting
- Predictive maintenance (when equipment will fail)
- Energy consumption forecasting (peak hour optimization)
- Staffing requirements (call center, field team)
Data Requirements
- Minimum data duration: 12-24 months (2 years recommended to capture seasonality)
- Data frequency: Daily, weekly, or monthly (problem-dependent)
- Additional variables: Promotion calendar, holidays, economic indicators
- Data quality: Missing values should stay below 5%
Success Metrics
- RMSE (Root Mean Square Error): Average error magnitude
- MAE (Mean Absolute Error): Absolute mean deviation
- MAPE (Mean Absolute Percentage Error): Percentage error (target: below 10-15%)
- Forecast Bias: Tendency for systemic over/under-forecasting
Classification

Classification is where you sort data into buckets automatically and let the decisions move faster
Classification models place input into predefined categories (classes). The output is discrete and categorical — A/B/C, Yes/No, Low/Medium/High.
Types of Classification Models
Binary Classification
Distinguishes between two classes:
- Churn prediction: Will stay / Will leave
- Credit risk assessment: Approve / Reject
- Spam detection: Spam / Not Spam
Multi-class Classification
Distinguishes between more than two classes:
- Customer segmentation: A / B / C / D segment
- Product categorization: Automatic assignment to 10+ categories
- Support ticket routing: Technical / Billing / Return / Other
Multi-label Classification
An input can belong to multiple classes:
- Document tagging: A document can be both “Contract” and “Confidential”
- Product features: A product carries multiple attributes
Classification Use Cases
Customer Analytics
- Customer segmentation (RFM + behavioral features)
- Churn prediction
- Lifetime value (LTV) category
- Purchase probability scoring
Risk Management
- Credit risk (low/medium/high)
- Supplier risk scoring
- Fraud detection
- Insurance claim estimation
Operational Classification
- Request prioritization (urgent/normal/low)
- Quality classification (A/B/C quality)
- Work order routing (department assignment)
- Automatic document classification
Common Algorithms
- Logistic Regression: Simple, interpretable, baseline
- Random Forest: Balanced performance, resistant to overfitting
- XGBoost/LightGBM: High accuracy, competition winner
- SVM (Support Vector Machine): Effective for high-dimensional data
- Neural Networks: Complex patterns, large datasets
Success Metrics
- Accuracy: Correct prediction rate (for balanced classes)
- Precision: Ratio of positive predictions that are truly positive
- Recall: Ratio of actual positives captured
- F1 Score: Balance between Precision and Recall (target: >0.75)
- AUC-ROC: Model discriminative power
Caution: Imbalanced Classes
If one class has far more samples than the others (say, 95% normal, 5% fraud), the model takes the easy road and simply predicts the majority class. When that happens, you need to restore balance with techniques like SMOTE, class weights, or undersampling.
Anomaly Detection

Anomaly detection catches what falls outside “normal” automatically, surfacing risk before it has a chance to grow
Anomaly detection automatically flags the non-normal points (outliers) in your data. The logic is simple: it profiles normal behavior first, then marks anything that does not fit that profile.
Anomaly Detection Approaches
Statistical Methods
- Z-Score: Deviation measurement based on standard deviation
- IQR (Interquartile Range): Outlier detection based on box plots
- Moving Average: Trend deviations in time series
Machine Learning Methods
- Isolation Forest: Isolation-based, fast and scalable
- One-Class SVM: Training with only normal data
- DBSCAN: Outlier detection via density-based clustering
- Autoencoder: Deep learning, complex patterns
Rule-Based Methods
- Business rules: “Invoice amount 10x average is an anomaly”
- Threshold alerts: Predefined threshold values
- Hybrid approach: ML + business rules combined
Anomaly Detection Use Cases
Financial Anomalies
- Invoice discrepancies (amount, date, supplier mismatch)
- Fraud detection (credit card, payment irregularities)
- Expense report violations
- Revenue recognition anomalies
Production and Operations
- Quality deviations (size, weight, color out of tolerance)
- Equipment behavior anomalies (vibration, temperature, pressure)
- Sudden increase in scrap rate
- Energy consumption anomalies
IT and Security
- Cyberattack detection (abnormal network traffic)
- Unauthorized access attempts
- System performance anomalies
- Event detection via log analysis
Supply Chain
- Delivery time anomalies
- Changes in ordering patterns
- Supplier performance deviations
- Inventory level irregularities
Data Requirements
- Normal data heavy: Anomalies are usually 1-5%
- Labeled data (for supervised): Known anomaly examples
- Timestamp: Critical for temporal anomalies
- Multi-variable: Situations that are normal individually but anomalous together
Success Metrics
- Precision: Rate of anomaly alarms that are truly anomalies
- Recall: Rate of actual anomalies captured
- False Positive Rate: False alarm rate (should be kept low)
- Detection Latency: Delay time in anomaly detection
NLP Applications (Natural Language Processing)

NLP pulls meaning out of messy, unstructured text and turns it into something you can automate against
Natural Language Processing (NLP) lets you extract, analyze, and generate meaning from text and speech data. In short, it turns the unstructured data sitting in your business workflows into something processable.
NLP Task Types
Text Classification
- Sentiment analysis: Positive / Negative / Neutral
- Topic classification: Email, support ticket routing
- Spam/ham detection
- Intent classification
Information Extraction
- Named Entity Recognition (NER): Person, company, date, amount
- Relationship extraction: Connections between entities
- Keyword extraction
- Summarization
Text Generation
- Automatic response suggestions
- Drafting reports
- Translations
NLP Use Cases
Customer Experience
- Complaint analysis and prioritization (via sentiment score)
- Chatbot and virtual assistant (customer support automation)
- Social media monitoring (brand perception analysis)
- Survey response analysis (open-ended questions)
Document Processing
- Automatic parsing of invoices, contracts, orders
- Contract clause analysis (risk detection)
- Email classification and routing
- Document search and matching
Knowledge Management
- Technical document indexing
- FAQ automation (similar question matching)
- Meeting notes summarization
- Research and report analysis
NLP Technical Infrastructure
- Tokenization: Splitting text into words/sub-words
- Word Embeddings: Word2Vec, GloVe, FastText
- Transformer Models: BERT, GPT, T5 family
- Pre-trained Models: BERTurk, mBERT for Turkish
Challenges
- Turkish NLP: Agglutinative language structure, resource limitations
- Domain-specific vocabulary: Adaptation to industry jargon
- Ambiguity: Different meanings of the same word
- Data privacy: Texts containing personal data
Computer Vision

Computer vision extracts information from images, moving inspections that were once done by eye into the digital world
Computer Vision analyzes visual data (photos, video) to extract information from it. It is widely used in production, logistics, and quality control.
Computer Vision Task Types
Image Classification
- Determining which category an image belongs to
- Example: Is the product defective or flawless?
Object Detection
- Detecting objects in an image along with their locations
- Example: How many products are on the shelf, where are they?
- Algorithms: YOLO, Faster R-CNN, SSD
Segmentation
- Classifying every pixel in an image
- Semantic segmentation: Class-based
- Instance segmentation: Object-based distinction
OCR (Optical Character Recognition)
- Digitizing text content in images
- Reading invoices, labels, license plates
Operational Use Cases
Quality Control
- Defect detection (scratches, stains, deformation)
- Dimension and measurement verification
- Color consistency check
- Assembly verification (missing part detection)
Inventory and Logistics
- Shelf counting (planogram compliance)
- Package sizing (volumetric measurement)
- Damaged product detection (during shipping)
- Barcode/QR code reading
Safety and Compliance
- PPE (Personal Protective Equipment) compliance
- Unauthorized area entry detection
- Crowd density analysis
- License plate recognition (parking, fleet management)
Document Processing
- Invoice/waybill digitization
- Identity document verification
- Handwriting recognition
- Form data extraction
Technical Infrastructure
- CNN (Convolutional Neural Networks): Basic image processing architecture
- Transfer Learning: Pre-trained models (ResNet, VGG, EfficientNet)
- Edge Computing: Processing near the camera (low latency)
- GPU Infrastructure: Required for training and inference
Data Requirements
- Image quality: Sufficient resolution and lighting
- Labeled data: 100-1000+ images per class
- Diversity: Different angles, lighting, background conditions
- Balance: Balance of sample counts between classes
Scenario Comparison Table
Review the comparison table below to see which AI scenario fits which situation:
| Scenario | Output Type | Data Structure | Typical Usage | Min. Data |
|---|---|---|---|---|
| Forecasting | Continuous number | Time series, tabular | Demand forecasting, cash flow | 12-24 months |
| Classification | Category | Tabular, text, image | Segmentation, risk scoring | 100+ samples/class |
| Anomaly Detection | Normal/Abnormal | Tabular, time series | Fraud, quality deviation | Normal data heavy |
| NLP | Text analysis | Unstructured text | Sentiment analysis, chatbot | 1000+ documents |
| Computer Vision | Visual analysis | Image, video | Quality control, counting | 100-1000+ images/class |
Scenario Selection Flow
Follow these steps to select the right scenario:
- Define the business problem: “Which decision do I want to automate?”
- Determine the output type: Number, category, or normal/abnormal?
- Evaluate the data structure: Tabular, text, image, or time series?
- Check the status of labeled data: Supervised or unsupervised?
- Select the scenario based on the table: Refer to the table above
Frequently Asked Questions (FAQ)
Get Support for Your Project
I can help guide your digital transformation initiative. Book a free preliminary call to discuss your priorities.