Data Capture in Manufacturing: A Tablet and Shop Floor Terminal Guide
What is Data Capture in Manufacturing and Why Is It Critical?

Real-time data capture creates a digital twin of the shop floor
Data capture in manufacturing—often called shop floor data collection—means recording everything that happens on the floor as it happens: when a work order starts and ends, how much you produced, downtime, quality results, material consumption. Nearly every decision in production management rests on this data.
What Happens Without Data Capture?
- Blind flying: Actual capacity utilization, efficiency, and losses stay unknown.
- Delayed response: Problems only surface at the end of a shift or day.
- Inaccurate costing: Without real labor and machine hours, costing is just guesswork.
- Planning errors: The gap between theoretical and actual capacity is invisible.
- Barrier to improvement: You cannot improve what you cannot measure.
What Data Should Be Captured?
A manufacturing data capture system typically covers the following:
Core Data Set (Mandatory)
- Work order information: Start time, end time, operator, machine.
- Production quantity: Good parts, scrap, rework quantity.
- Downtime records: Start/end time, reason code (planned/unplanned).
- Setup times: Mold/tool changeover, product transition times.
Extended Data Set (Recommended)
- Quality parameters: Measurement values, test results, non-conformance codes.
- Material consumption: Lot/batch-based raw material usage.
- Process parameters: Temperature, pressure, speed (via machine integration).
- Energy consumption: Machine-based electricity/gas measurement.
Data Capture Methods
On the shop floor, data comes in through three main routes:
- Manual entry: The operator enters data via a terminal or tablet.
- Semi-automated: Barcode/RFID scanning, plus operator confirmation or completion.
- Fully automated: Machine/sensor integration, PLC/SCADA connectivity.
In practice most plants end up with a hybrid: automatically captured data (counters, downtime) merged with data the operator fills in by hand (reason codes, quality notes).
Tip
Start with a “minimum viable data” mindset. In the first phase, capture only what you need to calculate OEE. Expand the data set once the system has settled and operators have built the habit. Asking for everything up front usually means nothing arrives cleanly.
Selecting Shop Floor Terminals and Tablets

The right terminal choice depends on the conditions of the production environment
Device selection comes down to environmental conditions, how often it will be used, and budget. Broadly, there are two categories: industrial shop floor terminals and commercial tablets.
Industrial Shop Floor Terminals
Features
- Protection rating: IP65 and above (dust/waterproof).
- Temperature range: Operational between -20°C and +50°C.
- Impact resistance: MIL-STD-810G standards.
- Display: Readable in sunlight, usable with gloves.
- Battery: Replaceable, long-life (12+ hours).
- Connectivity: Wi-Fi, Ethernet, optional 4G/5G.
Advantages
- Holds up in heavy industrial environments.
- Long service life (5-7 years).
- Professional service and spare parts support.
- Integrated barcode scanner, RFID option.
Disadvantages
- High initial cost.
- Limited model and brand selection.
- Less software flexibility than commercial tablets.
Commercial Tablets
Features
- Protection rating: Generally IP52-IP54 (limited protection).
- Ecosystem: Wide range of application stores.
- Cost: 1/3 to 1/5 the price of an industrial terminal.
- Updates: Operating system and application updates are easy.
Usage with Protective Accessories
- IP65 protection can be achieved with industrial cases.
- Mounting next to machines with adjustable stands.
- External barcode scanner attachments.
Selection Criteria
Decide based on the environment and how the device will be used:
- Heavy industry (metalworking, casting, welding): Industrial terminal recommended.
- Clean production (assembly, electronics, food): A tablet with a protective case is enough.
- Mobile usage (warehouse, shipping): Handheld industrial terminal.
- Fixed station (machine-side): Panel PC or wall-mounted tablet.
Placement Strategy
A separate terminal for every machine, or shared units? You are balancing two extremes:
- Machine-side terminal: Data entry is instant; the operator records the step right away. Investment cost is high.
- Shared terminal (work center-based): 3-5 machines share one terminal. Cost drops, but you risk delays in data entry.
- Mobile terminal: A shift supervisor or quality staffer carries a roaming device. Flexible, but not suited to continuous data entry.
Attention
A cheap device looks like a saving on day one. But in a production environment, quick failures, spare-parts headaches, and lost data claw that saving back with interest. Judge it on TCO (Total Cost of Ownership), not the sticker price.
MES Integration and System Architecture

MES acts as the bridge between the shop floor and management systems
MES (Manufacturing Execution System) collects and processes data from the shop floor, steers operations on the floor, and passes information up to the ERP platform. The data you capture in manufacturing is the primary input for MES.
ISA-95 Layers and Data Flow
The industrial automation standard ISA-95 divides systems into five layers:
- Layer 0: Physical process (product, machine).
- Layer 1: Sensors, actuators.
- Layer 2: PLC, SCADA (automation control).
- Layer 3: MES (manufacturing execution).
- Layer 4: ERP (enterprise planning).
Shop floor terminals talk directly to Layer 3, the MES. Where PLC/SCADA automation exists, you can also pull data from Layer 2.
MES Functions and Data Capture
- Work order management: Passing work orders from the ERP platform to the floor, start/end notifications.
- Resource management: Monitoring machine, operator, and tool status.
- Performance analysis: OEE calculation, downtime analysis, efficiency reports.
- Quality management: Control points, test results, non-conformance tracking.
- Traceability: Batch/lot-based raw material-to-product relationship.
- Document management: Viewing drawings, instructions, SOPs.
Integration Architectures
Direct ERP Integration (Without MES)
- The shop floor terminal sends data straight to the ERP platform.
- Fine for simple scenarios (work order start/end).
- Real-time analysis and detailed reporting stay limited.
- ERP performance can suffer during high production volume.
Integration via MES Layer
- Shop floor data is processed in MES; summary information moves up to the ERP platform.
- Real-time dashboards and analysis.
- Reduces ERP load, keeps detailed production data.
- Adds software and license costs.
Hybrid Approach
- Basic transactions (work order completion) go straight to the ERP platform.
- Detailed data (downtime, OEE) lives in a separate database.
- Analytical tools (BI) combine the two for reporting.
Connectivity Protocols
- REST API: Web-based integration, flexible and common.
- OPC-UA: Industrial standard, PLC/machine integration.
- MQTT: IoT protocol, lightweight and scalable.
- Database connection: Direct database write/read.
Data capture systems on the plant floor are one of the cornerstones of manufacturing sector digitalization, and ERP-MES integration is the backbone of that transformation.
Operator Interface Design

A simple, intuitive interface is the key to data quality
Whether a data capture system succeeds hangs less on the technology than on whether operators actually take to it. A complex, slow, or illogical interface will either sit unused or fill up with bad data—and either way you end up worse off than when you started.
Design Principles
1. Minimal Touch Operations
- Each transaction should be done in 3-5 touches at most.
- Keep the most frequently used functions on the main screen.
- Avoid unnecessary confirmation screens.
2. Large and Clear Buttons
- Sized for use with gloves (minimum 44x44px, preferably 60x60px).
- Status shown through color coding (green: start, red: stop).
- Text supported by icons.
3. Contextual Information
- Work order details (product, quantity, delivery date) visible.
- Technical drawings/photos viewable.
- Previous production notes accessible.
4. Feedback and Validation
- Visual/auditory confirmation after every transaction.
- Clear, understandable messages when something goes wrong.
- Blocking illogical data entry (validation).
Essential Screens
1. Login/Authorization
- Quick login via personnel card/barcode.
- PIN or fingerprint option.
- Shift/machine assignment.
2. Work Order Selection
- List of work orders assigned to the machine.
- Color coding based on priority.
- One-touch selection and start.
3. Production Recording
- Start/Stop/Complete buttons.
- Production counter (automatic or manual).
- Scrap/rework notification.
4. Downtime Notification
- Reason code selection (tree structure or list).
- Frequently used reasons at the top.
- Free-text note option.
5. Quality Entry
- Form specific to the control point.
- Measurement value entry or OK/NOK selection.
- Ability to attach photos.
Performance Optimization
- Fast startup: The application should be ready to use in 2-3 seconds.
- Offline operation: Operators should be able to enter data during a network outage, with the app syncing on reconnection.
- Low bandwidth: Performance shouldn’t drop on weak Wi-Fi.
Tip
Bring operators into the interface design. Run usability tests with at least 5-10 operators before the pilot. They’re the ones who will surface the practical problems a desk-bound design misses.
Barcode and RFID Applications
In the data capture process, barcodes and RFID cut down manual entry, minimize errors, and give you traceability.
Barcode Usage Areas
Work Order Tracking
- Quick selection and start with a work order barcode.
- Scanning from printed work order paper or the screen.
- Removes the risk of starting the wrong work order.
Personnel Authentication
- System login via the barcode on the operator card.
- Verifying work order start/stop authorization.
- Automatic recording of labor hours.
Material Traceability
- Scanning raw material lot/batch barcodes.
- Linking the product to the material used.
- Fast tracking in recall scenarios.
Product Labeling
- Unique serial/batch number for the produced item.
- Control of transition to the next station.
- Shipping and customer tracking.
RFID Usage Scenarios
Tool/Mold Management
- Attaching RFID tags to molds/tools.
- Automatic identification when mounted on the machine.
- Tracking usage count and maintenance timing.
- Preventing the wrong mold from being mounted (Poka-Yoke).
WIP (Work in Progress) Tracking
- RFID tag on the pallet/crate.
- Automatic scanning as items move between stations.
- Real-time workflow visibility.
Container/Pallet Loop
- RFID on returnable containers.
- Automating inventory counts.
- Spotting lost or delayed containers.
Barcode vs. RFID Comparison (in Production Environment)
- Cost: Barcode is far cheaper (label cost is negligible); RFID tag cost is higher per unit.
- Reading speed: Barcode reads one at a time, RFID reads in bulk.
- Line of sight: Barcode needs it, RFID doesn’t.
- Environmental durability: A dirty barcode can’t be read; RFID holds up better.
- Metal environment: RFID is affected by metal surfaces and needs special tags.
For most manufacturing applications, barcodes do the job just fine. RFID is worth putting on the table for high-value tool tracking, critical traceability, or full automation.
OEE Measurement and Calculation
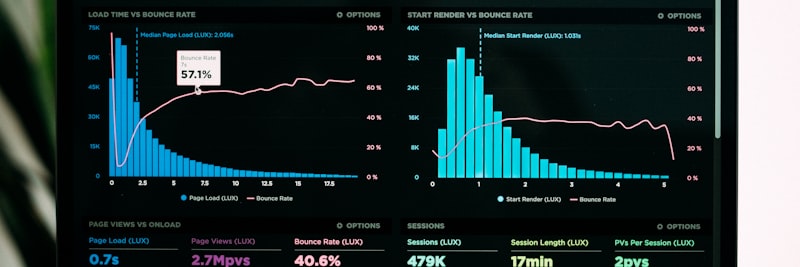
OEE boils production performance down to a single figure
OEE (Overall Equipment Effectiveness) is the universal measure of equipment efficiency, and it comes from multiplying three components: Availability x Performance x Quality.
OEE Components
Availability
Formula: Operating Time / Planned Production Time
You get it by subtracting downtime from planned production time. Downtime falls into two categories:
- Planned downtime: Scheduled maintenance, breaks, shift-start meetings (can be excluded from OEE).
- Unplanned downtime: Breakdown, waiting for material, setup, quality issues (lowers OEE).
Performance
Formula: (Actual Output x Ideal Cycle Time) / Operating Time
It compares what should theoretically have been produced during operating time against what actually was. Performance losses:
- Low speed: The machine running below its design speed.
- Minor stops: Micro-stops under 5 minutes (often never make it into the record).
Quality
Formula: Good Product Quantity / Total Production Quantity
The share of products made right the first time. Quality losses:
- Scrap: Defective products that can’t be fixed.
- Rework: Products that need correcting (which also hits you as lost time).
OEE Calculation Example
Let’s walk through it with representative values:
- Shift duration: 480 minutes
- Planned downtime (break): 30 minutes
- Planned production time: 450 minutes
- Unplanned downtime: 50 minutes
- Operating time: 400 minutes
- Availability: 400/450 = 88.9%
- Ideal cycle time: 1 minute/piece
- Theoretical output: 400 pieces
- Actual output: 350 pieces
- Performance: 350/400 = 87.5%
- Total production: 350 pieces
- Scrap: 10 pieces
- Good products: 340 pieces
- Quality: 340/350 = 97.1%
OEE = 88.9% x 87.5% x 97.1% = 75.6%
OEE Target Values
- World-class: 85%+
- Good level: 75-85%
- Average: 60-75%
- Low: Below 60%
Most facilities find themselves in the 50-65% range when they first start capturing data. With real-time data and systematic improvement, reaching 75%+ in 12-18 months is a realistic target.
Calculating OEE from the Data Capture System
The data capture system feeds you all three OEE inputs:
- For availability: Work order start/end, downtime start/end, reason codes.
- For performance: Production counter or manual quantity entry.
- For quality: Good/scrap quantity notification, quality control results.
MES or a reporting tool takes this data, calculates OEE automatically, and breaks the analysis down by machine, shift, and product.
Field Example: Manufacturing Facility Case

Situation
A metalworking facility with 85 employees. 12 CNC machines, 8 presses, 2 assembly lines. Where things stood: production was logged on paper forms at the end of the shift, and work orders were tracked by hand in Excel. Machine efficiency was unknown, and there was no systematic way to analyze downtime reasons.
Steps Taken (representative duration: 4 months)
- Month 1: Current state analysis, selection of 3 pilot machines, procurement of terminals and infrastructure.
- Month 2: Data capture goes live on the pilot machines, operator training, interface improvements.
- Month 3: Rollout to all CNC machines, defining downtime reason codes, OEE reporting begins.
- Month 4: Expansion to press and assembly lines, ERP platform integration, dashboard deployment.
Result (observed)
- Initial OEE measurement: average 52%
- OEE at the end of month 4: average 68%
- Identifying the most frequent downtime reason (waiting for material) and fixing the supply process.
- 25% reduction in setup times (the opportunity became visible once measurement started).
- Ability to calculate actual costs per work order.
7 Most Common Mistakes in Manufacturing Data Capture
1. Trying to Capture Too Much Data
Wanting to record everything from day one exhausts the operator and drags down data quality. Start with basic OEE data, then expand once the system is settled. Too many data fields usually means missing or wrong entries.
2. Design Without Operator Participation
An interface designed from behind a desk doesn’t hold up on the floor. Bring operators into the pilot phase. Their practical suggestions are what decide whether the system is usable.
3. Insufficient Training
The “the system is simple, they’ll figure it out” approach ends in bad data entry and resistance. Give every operator one-on-one or small-group training. Keep the training materials (visual guides) right next to the terminals.
4. Using Data as a Tool for Punishment
Use the first data that comes in for performance scoring or discipline, and you’ll kill data quality. Operators start gaming the system or dragging their feet. Spend the first 3-6 months using the data purely for process improvement.
5. Not Considering Offline Scenarios
If data can’t be entered during a network outage, trust in the system drops. Offline operation with later synchronization isn’t optional. Otherwise every network hiccup means lost data.
6. Incorrectly Defining Downtime Reason Codes
Too many or vague reason codes lead to either wrong selections or an “other” bucket that swells out of control. 10-15 main categories are enough at the start. Add detail later, as the data builds up.
7. Not Analyzing the Data
Data gets collected, and no one ever looks at it. On its own, data does nothing for you. Build a routine: weekly OEE review, monthly trend analysis, action planning. Data only creates value once it turns into a decision.

Proper planning and continuous analysis prevent errors
Success Metrics Table
Track the metrics below to gauge how the project is going (values are representative):
| Metric | Initial | Target | Measurement Method |
|---|---|---|---|
| OEE (average) | Unknown / 50-60% | 75%+ | Automatic calculation (MES/reporting) |
| Data entry rate | 0% | 95%+ | Terminal recorded work order / total work order |
| Downtime record completion | 0% | 90%+ | Downtime with assigned reason code / total downtime |
| Data delay time | End of shift | Real-time (within minutes) | Transaction time – system record time |
| Setup time | Not measured | 20-30% reduction | Average setup time trend |
| Unplanned downtime rate | Not measured | 30-40% reduction | Unplanned downtime / planned production time |
| Work order cost variance | Guesswork-based | Within +/- 5% | Actual vs planned labor/machine time |
Adapt these metrics to your own facility and report them monthly.
Data Capture in Manufacturing Checklist
The checklist below is a hands-on guide for rolling out a data capture project step by step. Work through each category in order:
- Project goals and scope defined
- Project sponsor and responsible team assigned
- Pilot area/machines determined
- Data set to be captured (core) defined
- Budget and timeline approved
- Terminal/tablet type selected (industrial/commercial)
- Placement strategy determined (machine-side/shared)
- Devices procured and tested
- Wi-Fi/network infrastructure sufficient in the production area
- Barcode scanners and printers procured
- Mounting and cabling completed
- Data capture software/MES selected or developed
- ERP platform integration defined and tested
- Offline operation scenario tested
- Reporting/dashboard interface prepared
- Interface design done with operators
- Usability test conducted
- Downtime reason codes defined (10-15 main categories)
- Work order information viewable on the terminal
- Data validation rules defined
- Training materials (visual guide) prepared
- Operators in the pilot group trained
- Pilot period started and monitored
- Feedback collected and improvements made
- Training program planned for all operators
- Data entry rate monitored daily
- OEE reports reviewed weekly
- Downtime analysis and action planning routine established
- Monthly performance evaluation meeting planned
- Data quality audit (random check) conducted
You can use this checklist as a starting reference in manufacturing sector digital transformation projects.
Frequently Asked Questions (FAQ)
Get Support for Your Project
I can help guide your digital transformation initiative. Book a free preliminary call to discuss your priorities.