From 8 Hours of Reporting to 5 Minutes in Logistics: Data Flow Design
The Real Cost of Manual Reporting: It Is Not Just Time

Past a certain data volume, manual reporting simply stops scaling
It is easy to shrug and say “reporting takes half a day, but it gets done anyway.” The trouble is that the real bill for manual reporting is hidden in the costs you never see on the invoice:
Time Cost (Representative)
- Operations analyst/manager: 3-4 hours of reporting daily
- Weekly management report: 8-10 hours (often overtime on weekends)
- Monthly performance report: 15-20 hours
- Annual total: 800-1000 hours spent solely on reporting
Data Error Cost
- Manual data entry error rate: 2-5% (depending on the industry)
- Wrong decisions built on wrong reports: hard to measure, very real
- Inconsistent metrics: Different people calculate them in different ways
- “Is this figure correct?” meetings: Weeks of debate
Opportunity Cost
- Real-time intervention is impossible: You hear about a problem 24 hours after it happens
- No trend analysis: “How did last month go?” has to wait until month-end
- No comparative analysis: You cannot see performance by driver, region, or customer
Run the numbers on a small case: a distribution fleet of 50 vehicles makes an average of 500 deliveries a day, and every delivery carries 15+ data points (time, location, status, signature, photo…). That is 15,000 deliveries a month, or 225,000 data points. There is no chasing that by hand.
Data Flow Architecture: From Where to Where?
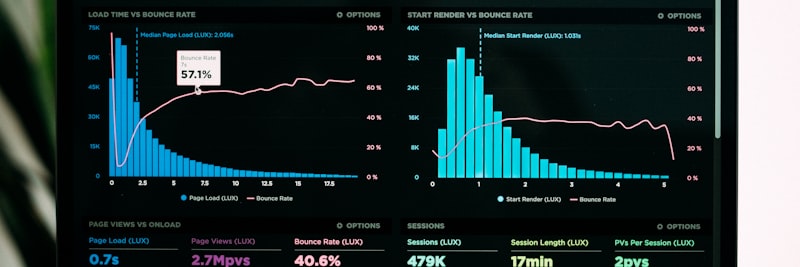
What turns raw material into insight is the data architecture behind it
Before you automate anything, map where the data comes from and where it needs to go. For a typical distribution operation, the sources and flow directions look like this:
Data Sources (Source Systems)
1. TMS (Transport Management System)
- Order information, route plan, delivery status
- Data format: Usually API or database connection
- Update frequency: Real-time or hourly batch
2. GPS/Telematics System
- Vehicle location, speed, engine status, fuel consumption
- Data format: API (mostly JSON/REST)
- Update frequency: Between 30 seconds and 5 minutes
3. WMS (Warehouse Management System)
- Loading time, package info, vehicle occupancy
- Data format: API or file transfer
- Update frequency: When loading is complete (event-driven)
4. Mobile Application (Driver)
- Delivery confirmation, signature, photo, exception log
- Data format: API (to mobile backend)
- Update frequency: Instantly upon each transaction
5. ERP/Accounting System
- Invoice info, customer master data, cost data
- Data format: API or database replication
- Update frequency: Daily batch is usually sufficient
Data Flow Layers
Raw data from the sources passes through four layers before it reaches anyone:
- Extraction: Data is pulled from source systems via API connections, database queries, or file transfers.
- Transformation: Data in different formats is reshaped into a common structure. This is where cleaning, normalization, and calculation happen.
- Loading: Processed data is loaded into a central database (data warehouse).
- Presentation: Dashboards, reports, and alert systems consume the data.
Run this process (ETL) on an automated schedule and the 8-hour manual grind collapses into 5 minutes.
TMS Integration: 6 Critical Data Points

The TMS sits at the heart of reporting – get the integration wrong and everything downstream breaks
With TMS (Transport Management System) integration, three questions have to be answered up front: which data you retrieve, how you retrieve it, and how often it should refresh:
1. Order and Delivery Information
- Fields to retrieve: Order no, customer code, delivery address, time window, product/quantity info
- Update frequency: When the order is created (event-driven)
- Critical point: Standardizing the address format (essential for geocoding)
2. Route and Stop Plan
- Fields to retrieve: Route ID, stop sequence, estimated time of arrival, estimated distance
- Update frequency: When the route is created, and on every change
- Critical point: Capturing route changes that happen mid-day
3. Vehicle Position (GPS)
- Fields to retrieve: Vehicle ID, latitude, longitude, timestamp, speed, direction
- Update frequency: Every 1-5 minutes (depending on operational needs)
- Critical point: Data volume is high, so plan for storage cost from the start
4. Delivery Status Update
- Fields to retrieve: Delivery ID, status (delivered/returned/partial/damaged), time, recipient info
- Update frequency: Real-time (instant)
- Critical point: Status codes must be standard and consistent
5. Driver Activity Log
- Fields to retrieve: Driver ID, activity type (start, break, end), time, location
- Update frequency: On every activity change
- Critical point: Essential for calculating idle time
6. Exception Logs
- Fields to retrieve: Exception type, description, photos, driver note
- Update frequency: Instant
- Critical point: Categorizing unstructured data (free text)
The steady, consistent flow of these 6 data points is the foundation of the whole reporting stack. Let one of them stall and the reports come out either incomplete or wrong, which amounts to the same problem.
Delivery KPIs: What to Measure and How?
You can measure dozens of things in a logistics operation. But trying to measure everything is, in practice, the same as measuring nothing. Here are the KPIs worth prioritizing, along with how to calculate them:
Primary KPIs (Should be monitored daily)
OTIF (On-Time In-Full)
- Definition: Orders delivered at the promised time and in the exact quantity
- Formula: (On-Time + Full Delivery) / Total Deliveries x 100
- Target: 95%+ (varies by industry)
- Note: The definition of “on-time” must be clear (15 min tolerance? 1 hour?)
First Attempt Delivery Rate
- Definition: Orders successfully delivered on the first attempt
- Formula: Delivered on First Attempt / Total Deliveries x 100
- Target: 90%+
- Note: A low rate translates straight into re-delivery cost
Average Delivery Time
- Definition: Time elapsed from the order reaching the warehouse to delivery
- Formula: Total Time / Number of Deliveries
- Target: Operation-specific (same day, next day, etc.)
Secondary KPIs (Should be monitored weekly)
Route Efficiency Rate
- Definition: Planned number of stops vs. actual
- Formula: Actual Stops / Planned Stops x 100
- Target: 95%+
Vehicle Occupancy Rate
- Definition: How much of the vehicle capacity is used
- Formula: Loaded Volume / Vehicle Capacity x 100
- Target: 80%+ (optimum 85-90%)
Cost Per Km
- Definition: Ratio of total operational cost to distance traveled
- Formula: Total Cost / Total Km
- Target: Downward trend
Alert KPIs (Triggering alerts)
Return/Damage Rate
- Threshold: Alert when it exceeds 3%
Number of Customer Complaints
- Threshold: Alert if it runs 50% above the daily average
Driver Overtime
- Threshold: Alert when legal working hours are exceeded
Field Example: Transformation of an 85-Vehicle Fleet

Company Profile (Representative)
FMCG distribution company. 85 vehicles, 1,200+ delivery points daily, 120+ drivers. Geographic scope: Regional distribution across multiple cities. Existing system: a TMS was in place, but reporting ran entirely on Excel.
Initial State
- Daily distribution report: Ready at 11:00 AM (4-hour delay)
- Weekly performance report: Monday noon instead of Friday (3-day delay)
- OTIF measurement: None (estimated around 75-80%)
- Driver performance comparison: None
- Route efficiency analysis: None
- Personnel tied up in reporting: 2 full-time
Steps Taken
- Weeks 1-2: Data source inventory. TMS, GPS, and WMS API documentation reviewed, data quality analyzed. 23 separate data issues surfaced.
- Weeks 3-4: Data cleaning and standardization. Address format fixed, stop codes standardized, driver ID mapping done.
- Weeks 5-8: ETL infrastructure setup. TMS and GPS API integration, hourly data extraction, central database created.
- Weeks 9-12: Dashboard development. Three main dashboards: Operational (real-time), Managerial (daily), Strategic (weekly/monthly).
- Weeks 13-16: Alert system setup. Automatic notifications for critical KPIs, plus mobile access.
4th Month Results (Representative Values)
- Daily report time: 4 hours -> 5 minutes
- Weekly report time: 12 hours -> 15 minutes
- OTIF visibility: None -> Real-time (82% initial, 89% by the 6th month)
- Data error rate: Estimated 5% -> 0.3%
- Reporting personnel: 2 people -> Reassigned to other tasks
- Decision-making speed: “We’ll look tomorrow” -> “I see it now”
Investment and Return
Investment items: Database/cloud infrastructure, ETL software license, dashboard tool, and consulting/development. At this scale, the payback period usually lands between 8 and 14 months, depending on the mix of personnel savings and productivity gains.
7 Fatal Mistakes in Logistics Reporting Automation
1. Skipping Data Quality
The “let’s build the dashboard first, we’ll fix the data later” approach. Result: the dashboard exists, the figures don’t add up, and nobody trusts it. Order matters here: data quality first, visualization second. Reverse it and the work is wasted.
2. Making Everything Real-Time
Real-time data flow is both expensive and complex, and it isn’t needed for every metric. Daily may be plenty for OTIF, while an hourly batch does the job for vehicle location. Define the actual need first.
3. Cramming Everything into One Dashboard
One screen with 30 KPIs and 15 charts that “shows everything.” Result: nobody can see anything. Split it by audience: Operational (driver/dispatcher), Tactical (operations manager), Strategic (senior management).
4. Not Clarifying Metric Definitions
“Delivery success” means something different to everyone. Sales: “Order delivered.” Operations: “Delivered on time.” Finance: “Payment collected.” One definition, one formula, one source.
5. Handing it to IT and Forgetting
A reporting system is a business project, not an IT project. If the operations team doesn’t own it, you end up with something technically perfect that nobody opens. Business unit ownership is non-negotiable.
6. Neglecting Historical Data
Only today and yesterday are visible. “Where were we the same period last year?” has no answer. For trend analysis, keep at least 12 months of history and pull it into the comparisons.
7. Creating Alert Fatigue
Fire a notification for every deviation and within a week nobody reads them. Keep alerts few, reserved for situations that actually require action. “Red = intervention required” should be the rule.

The right data, at the right time, in front of the right person
Logistics KPI Reference Table
The table below lists the key KPIs, industry averages, and target values for distribution operations:
| Metric | Industry Average | Good Level | Measurement Method |
|---|---|---|---|
| OTIF (On-Time In-Full) | 85-90% | 95%+ | TMS delivery data + timestamp |
| First Attempt Delivery Rate | 85-88% | 92%+ | Delivery attempt counter |
| Route Efficiency Rate | 88-92% | 96%+ | Planned vs. actual stops |
| Vehicle Occupancy Rate | 70-75% | 85%+ | WMS loading data / vehicle capacity |
| Cost Per Delivery | Variable | Downward trend | Total cost / number of deliveries |
| Driver Productivity (Delivery/Day) | 25-40 | 45+ | Daily deliveries / active drivers |
| Return Rate | 5-8% | <3% | Returned deliveries / total deliveries |
| Average Delivery Time | Operation-specific | Within SLA | Order time – delivery time |
Track these metrics daily, run weekly trend analysis, and report monthly in depth.
Weekly Reporting Health Checklist
Run through this list at the start of every week:
Data Quality
- Are source systems sending data?
- Did ETL jobs complete successfully?
- Are data delays within normal limits?
- Are there inconsistent or empty fields?
KPI Performance
- Is OTIF below target?
- Is the first attempt delivery rate trending down?
- Is the return rate creeping up?
- Is there a route efficiency deviation?
Operational Action
- Were last week’s deviations analyzed?
- Were root cause analyses performed?
- Were corrective actions planned?
- Was driver-based performance reviewed?
System Health
- Are dashboards loading correctly?
- Is mobile access working?
- Are alert notifications going out?
- Are user access permissions up to date?
Frequently Asked Questions
Logistics reporting automation is the process of collecting, processing, and reporting data from TMS, WMS, ERP, and field devices without anyone touching it by hand.
A manual 8-hour reporting process can be reduced to 5 minutes with a well-designed data flow. That figure isn’t an exaggeration; it is simply the ETL runtime plus the dashboard refresh time added together.
Automation also minimizes human error and enables real-time decision-making.
Six critical data points stand out in TMS integration:
- Order info: Customer, address, time window
- Route and stop plan: Planned sequence and ETA
- Vehicle position: GPS data
- Delivery status: Delivered/returned/partial/damaged
- Driver activity: Start, break, end
- Exception logs: Reason for delay, damage note
This data must flow to the central database hourly or in real-time.
Eight key KPIs for delivery performance:
- OTIF (On-Time In-Full): 95%+ target
- First attempt delivery rate: 90%+ target
- Average delivery time: Within SLA
- Route efficiency rate: Planned vs. actual
- Vehicle occupancy rate: 80%+ target
- Cost per km: Trend analysis
- Return/damage rate: <3% target
- Customer satisfaction: Survey/NPS
Monitor these KPIs daily, weekly, and monthly, and run trend analysis on top.
In logistics, a hybrid approach works best:
- Real-time (Streaming): For operational decisions – route changes, urgent deliveries, vehicle tracking
- Batch ETL: For management reports and trend analysis – daily/weekly summaries
What really decides the outcome is the data quality and timing of the source systems. Real-time systems should run with a 5-15 second delay, and ETL jobs should finish outside working hours, overnight.
Making everything real-time is expensive and, in most cases, unnecessary.
Five critical mistakes in logistics dashboards:
- Too many metrics: 20+ KPIs on a single screen make decisions harder. 5-7 key metrics per audience is enough.
- Wrong aggregation: Daily averages hide the instant spikes. Show both the average and the min/max.
- Lack of comparison: A metric with no previous period or target value is meaningless.
- No connection to action: A red indicator with no clear next step is useless. Every alert should carry an action guide.
- Mobile incompatibility: If the field manager can’t see it on a phone, it won’t get used. Responsive design is a must.
For fleets of 10+ vehicles, reporting automation usually pays for itself within 6-12 months.
Where the gains come from:
- Reporting staff time: 10-15 hours saved per week
- Wrong decisions caused by data errors: a real cost, even if hard to measure
- Opportunities lost to delayed information: customer complaints, re-deliveries
Start with cloud-based, scalable solutions. Steer clear of systems that demand a large upfront investment; let the system grow as you do.
Get Support for Your Project
I can help guide your digital transformation initiative. Book a free preliminary call to discuss your priorities.