IoT and Field Integration | Bringing Production, Warehouse, and Field Data to Management
Do you learn about machine failures on the production line only after they occur? Do you lose product when warehouse temperatures climb past critical levels? Does your field team still work with paper forms, the data reaching head office two days later?
In this guide we cover how to move production, warehouse, and field data into your central systems in real time with IoT (Internet of Things): which sensors to use, how to design the connectivity architecture, and how to keep everything running when the internet drops.
Table of Contents
- What is IoT and Field Integration?
- Operational Benefits: Real-Time Monitoring
- Sensor Types and Use Cases
- Connectivity Architecture: Edge, Gateway, and Cloud
- Data Collection and Processing Layers
- Turkey/TRNC Realities: Offline Mode and Internet Outages
- Field Example: Multi-Location Production
- 7 Common IoT Implementation Mistakes
- IoT Project KPI Table
- IoT Integration Checklist
- Frequently Asked Questions (FAQ)
What is IoT and Field Integration?

Every machine on the floor is really a data source waiting to be read
At its simplest, IoT (Internet of Things) means physical devices, machines, sensors, and vehicles, sending and receiving data over the internet. Field integration is the part that actually matters to you: moving that raw data into central systems like ERP, BI, or MES and turning it into a business decision.
In the traditional approach, a field employee reads a machine counter twice a day, writes it down, and keys it into Excel in the evening. With IoT, a sensor takes the reading itself every 5 seconds, the data lands in the system instantly, and management gets an alert the moment something looks off. The difference is a few hours of lag versus a few seconds.
Key Components of IoT Integration
- Sensors: Measure physical quantities (temperature, pressure, vibration)
- Gateway: Collects sensor data, performs protocol conversion, and stores data locally even without internet
- Cloud/Server: Stores data, performs analysis, generates reports
- API/Integration: Enables data exchange with systems like ERP, MES, dashboards
A concrete example: a vibration sensor on the production line catches a machine drifting outside its normal operating range. The gateway stamps the reading with a timestamp, sends it to the cloud, and the system opens a work order for the maintenance team on its own. Start to finish, the whole thing takes 30 seconds.
Operational Benefits: Real-Time Monitoring
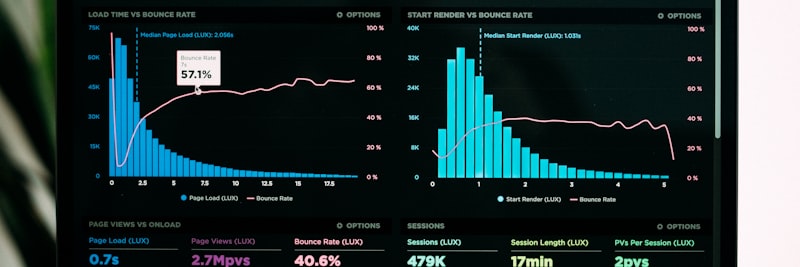
One live screen that answers “what is happening right now?”
1. Elimination of Manual Data Entry
The data field employees used to write down and carry back to the office now goes straight into the system from the sensor. Human error drops to essentially zero, and data latency falls from hours to minutes.
2. Predictive Maintenance Alerts
Anomalies in vibration, temperature, and current show up before a machine actually fails. That lets you schedule maintenance in advance and keep unplanned downtime to a minimum.
3. Inventory and Logistics Visibility
Warehouse temperature, product location (RFID), and vehicle location (GPS) are all tracked in real time. Cold chain violations get caught in the first minute, and routes are adjusted accordingly.
4. Increased Decision-Making Speed
Senior management sees current data on live dashboards. Instead of asking “What happened last week?”, they get an answer to “What is happening right now?”. Decisions rest on data rather than guesswork.
5. Energy and Cost Optimization
Energy consumption is monitored machine by machine, and idle equipment surfaces quickly. In most plants this is exactly where the first hidden waste is found, and energy costs come down proportionally.
Sensor Types and Use Cases

The right sensor depends entirely on the problem you’re solving
1. Temperature and Humidity Sensors
Use Case: Warehouse climate control, production environment, food cold chain.
Example: Automatic alarm when warehouse temperature exceeds 8°C.
2. Vibration Sensors (Accelerometer, Vibration)
Use Case: Machine health monitoring, maintenance planning.
Example: Notification to the maintenance team when vibration levels on a CNC machine exceed normal limits.
3. Current and Energy Sensors
Use Case: Energy consumption monitoring, idle equipment detection.
Example: Compressor running idle overnight, detecting energy waste.
4. Pressure Sensors
Use Case: Hydraulic and pneumatic systems, liquid tanks.
Example: Oil level warning when pressure drops in a hydraulic press.
5. GPS and Location Sensors
Use Case: Vehicle tracking, field team routes, logistics optimization.
Example: Which customer the service team is at, how long ago they left, traffic conditions.
6. RFID (Radio Frequency Identification)
Use Case: Product tracking, inventory counting, entry-exit control.
Example: Every pallet passing through the warehouse door is automatically recorded in the system.
7. Camera and Image Sensors
Use Case: Quality control, AI-assisted defect detection.
Example: Surface defects on the production line are automatically detected, and defective products are separated.
Connectivity Architecture: Edge, Gateway, and Cloud

Edge, gateway, and cloud split the work across three layers
Layer 1: Edge Computing
The layer closest to the sensor. When response has to be immediate, an emergency stop, for instance, the data never travels to the cloud; the edge device decides on the spot. Latency sits at the millisecond level.
Example: When machine vibration reaches a dangerous level, the edge device cuts the relay without consulting the cloud, stopping the machine.
Layer 2: Gateway (Data Collector)
Collects data from multiple sensors, performs protocol conversion (like Modbus, OPC UA, MQTT), packages the data, and sends it to the cloud. Its most important trait, though, is the offline buffer. When the connection drops, it holds the data in local memory and uploads all of it automatically once the link is back.
Example: There are 12 machines on the production floor, each using a different protocol. The gateway collects them all and sends them to the central system via HTTPS.
Layer 3: Cloud (Cloud Server)
The layer where all the data lands, analytics run, and reports are produced. ERP, BI, and dashboard integrations happen here.
Example: Production data from all branches is consolidated in the cloud, and management monitors the entire operation from a single dashboard.
Architecture Selection Criteria
- Decision Speed: If milliseconds are required, use edge; if minutes are sufficient, use cloud.
- Internet Reliability: If low, a gateway is mandatory.
- Data Volume: If high, perform pre-processing at the edge and then send summaries to the cloud.
- Security: If critical data is involved, edge/gateway encryption is essential.
Data Collection and Processing Layers
A piece of IoT data passes through several layers on its way from a raw sensor reading to a business intelligence report:
Layer 1: Raw Data
The direct output from the sensor. Example: “43.2°C, 12:34:56”
Layer 2: Cleaning and Filtering
Erroneous readings (outliers) are filtered, and unit conversions are performed.
Layer 3: Contextualization
Metadata is added to the data: which machine, which location, which process.
Layer 4: Aggregation and Analysis
Hourly and daily averages are calculated. Trends are identified.
Layer 5: Business Rules and Actions
When a threshold is exceeded, a work order is automatically created, or a notification is sent.
Layer 6: Reporting and Visualization
Presented as dashboards, Power BI reports, or Excel reports.
Example Data Flow:
Sensor: 92.4 mA → Gateway: “Machine-003, 92.4 mA, 14:22:10” → Cloud: “Normal range 80–100 mA, OK” → Dashboard: “Machine-003 is healthy, consumption is normal”
Turkey/TRNC Realities: Offline Mode and Internet Outages
In Turkey’s industrial zones, and across the island in TRNC, an internet outage isn’t the exception; it’s a routine fact of life. So the success of an IoT project comes down largely to whether it can keep working without internet.
Offline Mode Architecture
The gateway device holds sensor data in its local memory (SD card, SSD). Synchronization starts on its own once the connection returns, with no manual intervention required from the user.
Offline Buffer Capacity Calculation
Example calculation:
– 10 sensors, each reading every 10 seconds (60 readings per minute)
– Each record is 100 bytes
– Hourly data: 60 × 60 × 100 bytes = 360 KB
– 7-day buffer: 360 KB × 24 × 7 = 60 MB
The upshot: 1 GB of memory comfortably covers more than 4 months of outages. In practice the longest outages run a few hours, so data loss simply doesn’t happen.
TRNC Specific Situation
Since power cuts are also frequent in TRNC, a UPS (uninterruptible power supply) is non-negotiable for gateway devices. I’d recommend at least 2 hours of battery capacity.
Offline Mode Critical Points
- Time Synchronization: The gateway’s clock must be accurate (NTP server).
- Memory Management: If the buffer fills up, the oldest data is deleted (FIFO).
- Conflict Management: The same data should not be sent twice (unique ID).
- Error Notification: If there has been no internet for 24 hours, an SMS is sent to management.
Field Example: Multi-Location Production and Warehouse

Situation
A metal processing company with production facilities in 4 cities and 2 regional warehouses, 320 employees in total. The production line runs 18 CNC machines, each monitored by hand. Warehouse temperatures get written down on paper twice a day. Machine failures are reported only once an operator notices them, which is exactly why downtime stays high.
Problems
- Machine failures are addressed reactively; there is no planned maintenance.
- Warehouse temperature increases overnight go unnoticed.
- Production data is in Excel, with daily reports ready by 10 AM the next day.
- Data loss occurs after internet outages.
Implemented IoT Solution
- Phase 1 (4 weeks): Pilot facility selected (Ankara). Vibration + current sensors installed on 3 CNC machines, and a temperature sensor in 1 warehouse. Gateway tested with offline buffer.
- Phase 2 (8 weeks): Sensors installed on all 18 machines, and climate sensors in all warehouses. Gateways deployed at 4 locations.
- Phase 3 (12 weeks): ERP integration completed. Maintenance work orders are generated automatically. Dashboard went live.
Results (6th Month)
- Planned maintenance rate: 12% → 74%
- Machine downtime: reduced by an average of 18%
- Warehouse temperature violation detection time: 18 hours → 5 minutes
- Production reporting delay: 20 hours → real-time
- Data loss after internet outage: 0%
7 Common IoT Implementation Mistakes
1. Starting Without Offline Mode
Ignoring the reality of internet outages and installing without any gateway buffer capacity. The result is predictable: data loss on the first outage, and eroded user trust.
2. Too Many Sensors, Too Little Analysis
The “let’s put sensors everywhere” approach. Data piles up, but no one looks at it and no decisions get made. IoT should produce actions, not just data.
3. Neglecting Security and Encryption
Sensor data sent over open protocols (HTTP, plain MQTT). Production data can leak externally, or devices can be hijacked. TLS/SSL is essential.
4. Forgetting Time Synchronization
If the gateway clock is off, the timestamps are off, and reports end up inconsistent. Automatic time synchronization via an NTP server is mandatory.
5. Not Planning for Scalability
You start with 3 pilot sensors, but the gateway runs out of headroom once you scale to 100. Pick a scalable architecture from day one.
6. Skipping Maintenance and Calibration
Sensors drift over time (measurement shifts). If calibration is not performed every 6 months, data reliability decreases. A maintenance schedule is essential.
7. Delaying ERP Integration
The usual line is “Let’s install the sensor first, integration later.” Data shows up on the dashboard but never connects to the actual business process. If IoT data doesn’t flow into the ERP, its value stays limited.

Most of these mistakes get prevented at the planning table, not on the floor
IoT Project KPI Table
The metrics to watch if you want to know whether your IoT integration is actually paying off:
| Metric | Baseline | Target (6 Months) | Measurement Method |
|---|---|---|---|
| Data Latency | 18 hours | <5 minutes | Timestamp analysis |
| Manual Data Entry Rate | 100% | 5% | Record source tracking |
| Planned Maintenance Rate | 15% | >70% | Maintenance work order type |
| Machine Downtime | Baseline | -20% | OEE calculation |
| Alarm Response Time | 45 minutes | <10 minutes | Ticket creation time |
| Sensor Uptime | – | >99% | Heartbeat log |
| Offline Buffer Success | – | 100% | Sync log after outage |
| Data Accuracy Rate | 82% | >98% | Calibration + validation |
IoT Integration Checklist
The critical items to keep checking at every stage of your IoT project:
Discovery and Planning
- Which processes will benefit from IoT? Have priorities been set?
- Existing Infrastructure: Has internet reliability been measured?
- Sensor Selection: Are they suitable for physical conditions (dust, humidity, vibration)?
- Gateway Capacity: How many sensors will connect, and for how many days is the buffer?
- Security: Have TLS/SSL, VPN, and firewall rules been defined?
Technical Installation
- Sensor Mounting: Is it in the correct location? Has calibration been performed?
- Gateway Installation: Is it protected by a UPS? Is NTP synchronization active?
- Offline Buffer Test: Is there data loss when the internet is disconnected?
- Protocol Conversion: Are Modbus, OPC UA, MQTT working correctly?
- Cloud Connection: Have HTTPS, auth tokens, and rate limit settings been configured?
Integration and Testing
- ERP Integration: Are API documents ready? Have test data been transferred successfully?
- Dashboard: Are user roles defined? Is real-time updating functioning?
- Alarm Rules: Are threshold values correct? Have notification channels been tested?
- Data Quality: Is outlier filtering active? Are unit conversions correct?
- Performance Test: Is the system stable when 100 sensors send data simultaneously?
Go-Live and Monitoring
- Pilot Test: Did it start with 1 machine or 1 area?
- User Training: How to read the dashboard, what to do when an alarm occurs?
- Maintenance Plan: Will sensor calibration be performed every 6 months?
- Monitoring: Are sensor uptime and data latency metrics being tracked?
- Documentation: Is the technical architecture and troubleshooting guide ready?
Frequently Asked Questions (FAQ)
Get Support for Your Project
I can help guide your digital transformation initiative. Book a free preliminary call to discuss your priorities.